Exploring historical data through visualisation.
Latest Posts

8 Podcasts for Historians who want to get into Data Visualisation.
by
Graeme Kemp,
posted April 23, 2021
Podcasts have become absolutely integral to my learning journey. Read about the ones I listen to so I can keep up with the programming and data visualisation.
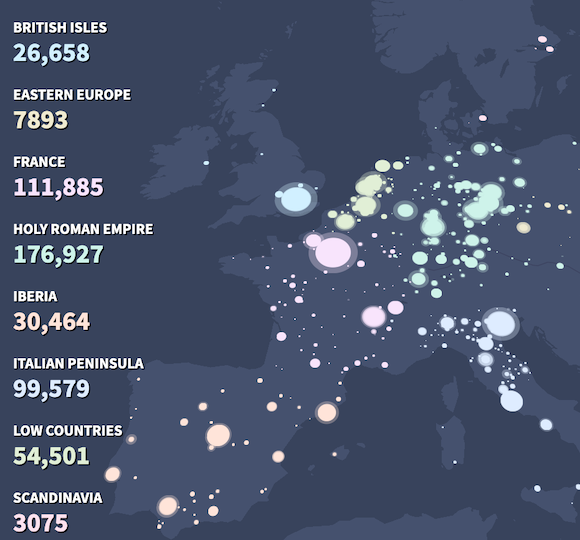
The Spread of European Printing Activity (1450-1650). Mapped!
by
Graeme Kemp,
posted June 17, 2020
In the first in a series of posts looking at the Geography of the Book, Graeme Kemp discusses mapping the output of places of printing in Europe before 1650.
Traherne Digital Collator: visual collation and the printed page
by
Giles Bergel,
posted May 25, 2020
Book historian and digital humanist Giles Bergel looks at exciting new ways to compare multiple texts using Traherne - a free to download digital tool that can assit in the comparison of digital images of different copies of the original printed page.
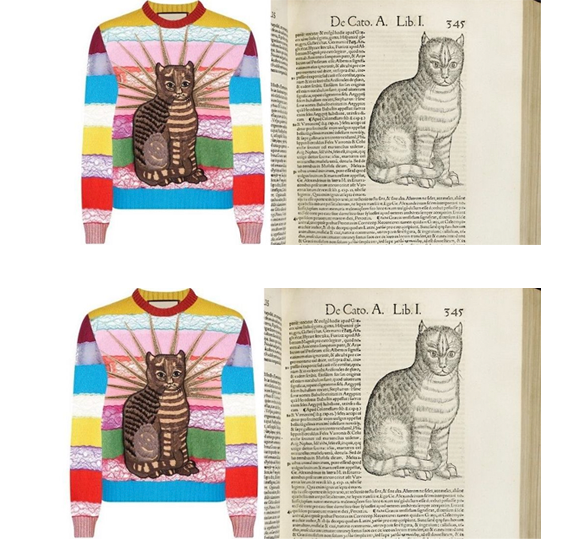
It’s all Gucci (and Gessner)
by
Nora Epstein,
posted April 29, 2020
Nora Epstein of the University of St Andrews looks at visualising the transmission of woodcut images in early modern England.
Counting Sheets and Editions: Visualising Parisian Printing in the Sixteenth Century
by
Graeme Kemp,
posted April 17, 2020
Graeme Kemp looks at the process of sheet counting and how it can help give a different perspective on our understanding of early modern printing.
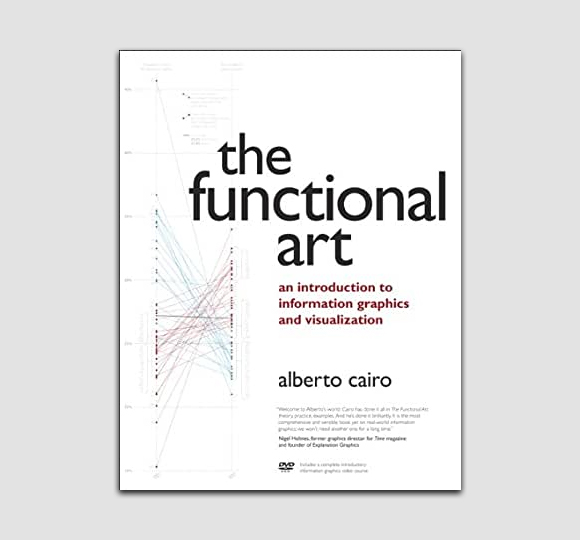
Book Review: The Functional Art: An introduction to information graphics and visualization, by Alberto Cario
by
Richard Bellis,
posted April 10, 2020
Richard Bellis reviews (with a historians eye!) one of the classic texts of information graphics - Alberto Cario's Functional Art.
Second-Hand Science
by
Simon Werrett,
posted April 03, 2020
One of the princial projects Visualising History is engaged in is examining auction records. In this post, Professor Simon Werret of University College London discusses second-hand science at auction.

Visualising Changes between Book Editions Using Juxta Commons
by
Richard Bellis,
posted March 25, 2020
Richard Bellis looks at how to utilise Juxta Commons for investigating historical patterns.
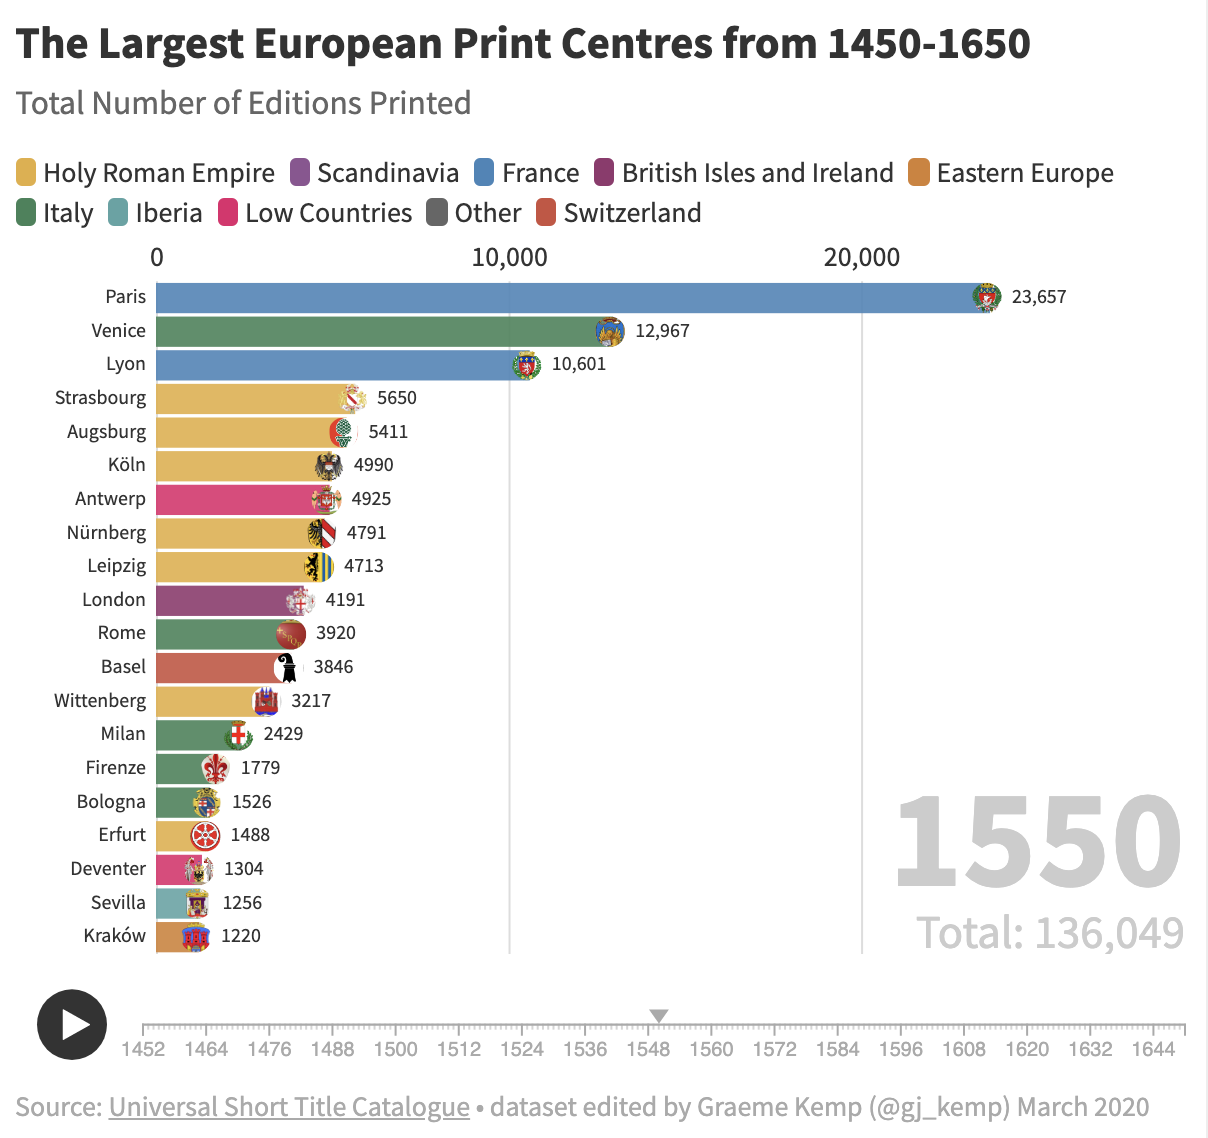
Off to the Bar Chart Race(s): The Largest Print Centres Through Time (1450-1650)
by
Graeme Kemp,
posted March 18, 2020
Watch the race to be the largest European print centre, from the fifteenth century to the mid-seventeenth century. Graeme Kemp looks at how the centres for the production of books has shifted over time and how.